Only 36 of 5,346 Corporate Records Attach a Figure to an Environmental Claim as Unquantified ESG Statements Score 0.32 Points Below Announcements Making No Sustainability Claim at All
A disclosure ladder analysis finds that social themes outweigh environmental ones by more than two to one, that SDG3 Good Health accounts for 252 of 443 SDG mappings, and that quantified carbon impact at 7.42 is among the highest-yield filters identified across the July report series
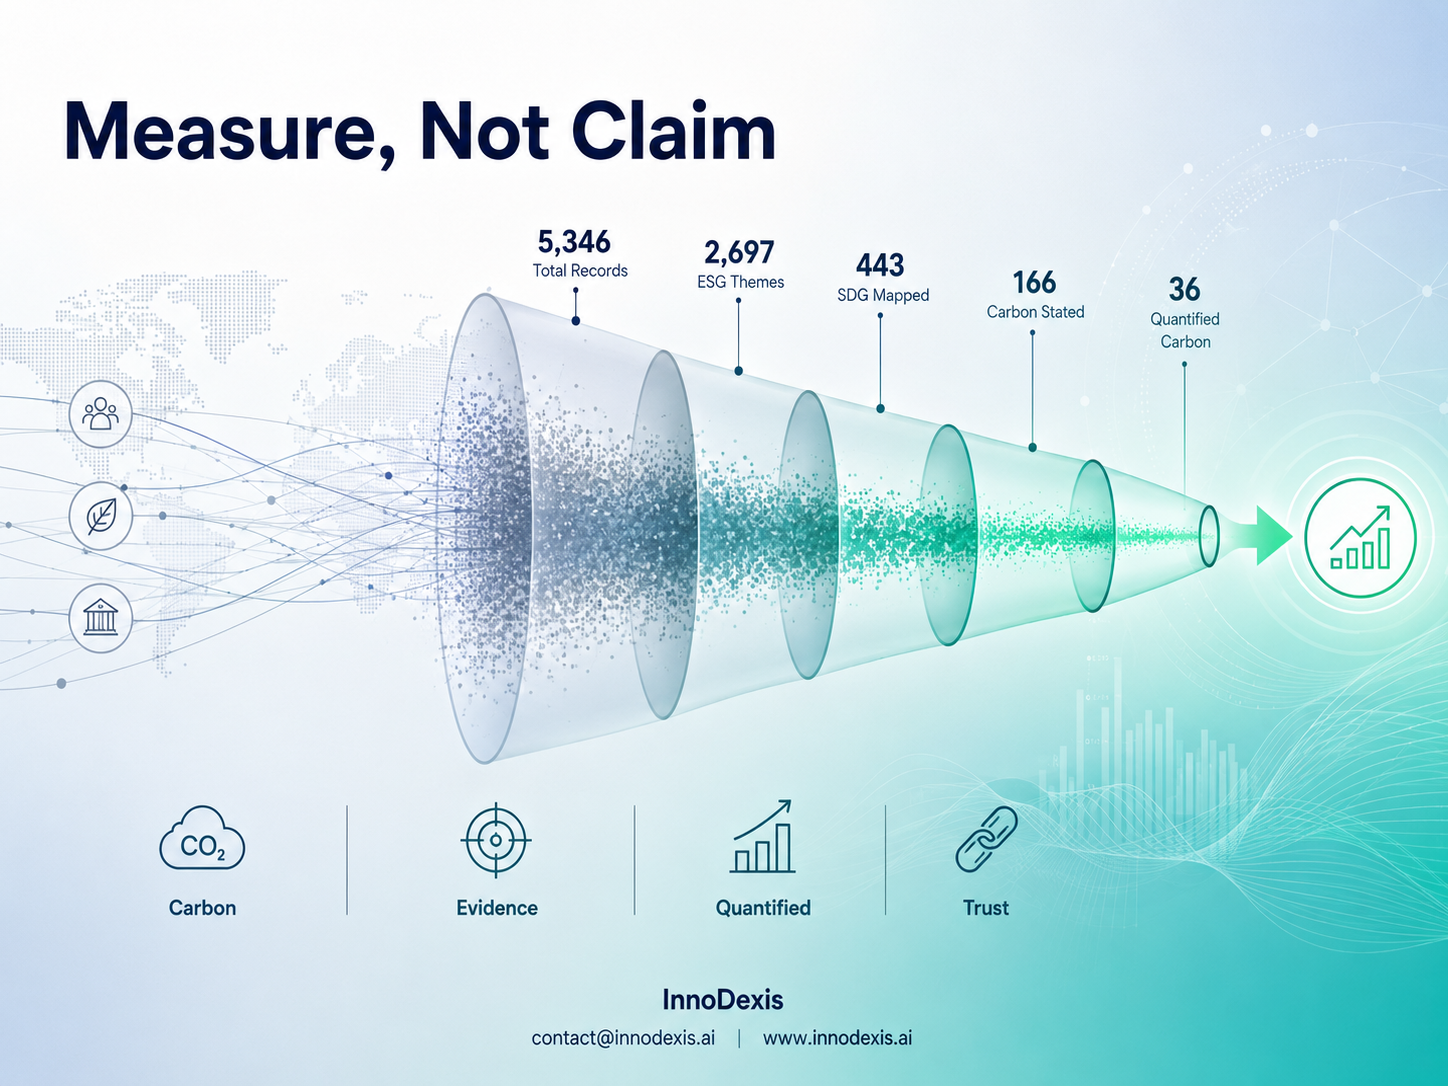
InnoDexis has published its latest Corporate Intelligence Report — Claim and Measure — analyzing ESG and sustainability disclosure fields across 5,346 valid Corporate-stream records during July 2026. The report reveals that 2,697 records — 50.4% of the stream — name an ESG theme, while only 36 records — 0.7% of the stream — attach an actual figure to an environmental claim. Records making an unquantified ESG claim average an InnoDexis score of 5.33, measurably below the 5.65 average for records making no sustainability claim at all, while records carrying a quantified carbon impact average 7.42 — nearly two points above the stream mean of 5.52.
Key Findings
The ESG disclosure funnel narrows by a factor of 75 between the broadest and strictest evidence levels. Of 5,346 valid records, 2,697 name an ESG theme and 2,201 state a sustainability objective — claim-level fields that are well populated. UN SDG mapping appears on 443 records, carbon or greenhouse gas impact statements on 166, and applying one further test — whether a carbon statement contains an actual figure with a unit — reduces the confirmed cohort to 36 records. Of the 166 records stating a carbon or greenhouse gas impact, only 21.7% include a number with a unit. The remaining 78.3% describe carbon qualitatively — decarbonisation commitments, low-emission models, electric fleets — statements about carbon rather than measurements of it.
The greenwash gap is the report's central finding and rests on samples large enough to be structurally firm. Records making no sustainability claim at all average 5.65 across 2,633 announcements. Records naming an ESG theme but supplying no SDG mapping and no carbon statement average 5.33 across 2,115 records — a 0.33-point deficit relative to silence, with standard deviations close to 1.85 in both groups confirming the gap is not noise. The report identifies this as compositional rather than causal: the service-heavy, small-organisation segment of the Corporate stream — already identified through product type, founder voice, and service positioning in earlier July reports — makes sustainability claims at high rates because they are cheap to make, and that same segment scores low for reasons unconnected to sustainability.
Above the claim floor the disclosure ladder is monotonically steep. SDG mapping recovers the average to 5.42, a stated carbon impact to 6.61, and a quantified carbon impact to 7.42 — more than two points above the unquantified claim. The 36 records at the top of the ladder carry a median TRL of 7.5, meaningfully earlier than the stream's TRL 9 mass, indicating these are operating technologies with measured performance rather than completed deployments with retrospective narratives.
Social themes outweigh environmental ones by more than two to one across the 2,697 ESG-claiming records. Social themes appear on 1,708 records, environmental on 840, and governance on 233. The sector split is close to binary. Energy and Utilities frames sustainability 82.4% environmentally, Agriculture and Environment 82.0%, Manufacturing 73.6%, and Transport and Logistics 59.3%. Healthcare and Life Sciences frames it 88.6% socially, Media and Entertainment 89.7%, and Education 89.9%. The report identifies physical operational footprint as the dividing line — sectors that burn fuel, move freight, or process materials describe sustainability in terms of emissions because they can be held to them. Financial Services is the instructive exception, with the highest governance share at 26.4%, the only sector for which governance is a substantial ESG category.
SDG mapping further confirms the health-over-climate composition. SDG3 Good Health and Well-Being accounts for 252 of 443 mentions — more than the next four goals combined. Quality Education follows at 70, Sustainable Cities at 60, and Decent Work at 47. Climate Action appears 31 times and Affordable and Clean Energy 28. The environmental goals as a group account for a minority of all SDG mappings despite comprising seven of the seventeen goals, and the report warns explicitly that SDG mapping in this dataset is a health and social development signal rather than a proxy for environmental commitment. Scope 3 emissions — where the footprint of immaterial sectors actually sits — are named in only four records across the entire month, and only one of those four attaches a figure.
Strategic Insight and Trend Analysis
The most operationally consequential finding of the Claim and Measure report is the inversion of the intuitive ESG screening logic. ESG theme presence is a negatively predictive signal in this dataset — using it as a filter selects a cohort scoring 0.32 points below the baseline of no sustainability content at all. This is not a marginal difference on a negligible sample. It is a statistically firm result on samples of more than 2,000 records on each side, and it means any scouting, investment, or policy analysis that screens for ESG-claiming announcements is actively degrading its signal quality compared to the stream baseline.
The correct filter is at the other end of the disclosure ladder. A quantified environmental metric — a number with a unit inside the carbon, greenhouse gas, or comparable field — is present in only 36 records at 0.7% of the stream, but those 36 records average 7.42 against a stream mean of 5.52. The filter requires only detecting a numeral adjacent to a recognised unit, is among the cheapest high-yield computational operations identified across the July series, and applies to a field group that is currently generating no filtering value when used at the claim level.
The Scope 3 gap is the most structurally significant measurement absence in the data. Four records in a full month name Scope 3 emissions, and only one attaches a figure — a 47% reduction in greenhouse gas emissions compared to conventional cotton growing, from a partnership addressing agricultural inputs to textile production. Scope 3 is where the majority of most consumer and technology companies' actual environmental footprint sits, in supply chains rather than in owned operations, and its near-total absence explains why sectors without physical operations report no carbon impact in this field group: their emissions are real, they are auditable, and they belong in accounting terms to someone else. As mandatory Scope 3 reporting expands across multiple jurisdictions under currently legislated sustainability disclosure frameworks, this is the measurement gap most likely to produce a visible change in this data within the next two to three years.
Global and Industry Implications
For corporates and R&D teams, the five quantified records illustrate the range of environmental accounting forms that distinguish measurement from claim. Dubai Electricity and Water Authority's dual disclosure — approximately 8 million tonnes of annual carbon dioxide reduction alongside avoiding more than 36 billion cubic feet of natural gas combustion — provides the reference standard: two figures, both with units, both attached to a physically auditable baseline. Entropy Inc. and Advantage Energy's carbon intensity disclosure at 84 kilograms per megawatt-hour is identified as the most analytically useful form in the dataset, because intensity expressed per unit of output is comparable across facilities in a way that absolute totals are not. GreenCore Solutions' disclosure of up to 80% lower token use and energy consumption per transaction than a generalist model identifies the metric form that Technology and Software — a sector currently disclosing carbon impact on only 2.9% of its records — will need to adopt as inference workloads scale.
For investors with sustainability mandates, the 166 carbon-stating records and particularly the 36 quantified ones at median TRL 7.5 are identified as the only defensible environmental cohort in this data. Anything broader is claim rather than evidence, and the report is explicit that ESG theme presence should not be surfaced as a filter — it selects a segment scoring below the no-claim baseline. The Avalo and Advance Denim partnership record is identified as the month's most structurally significant environmental disclosure for investors with supply chain exposure: the only Scope 3 quantified record in the full month, reporting a 47% reduction in greenhouse gas emissions at the agricultural input layer, in a category where the emissions effect would propagate through every downstream user of the treated cotton if the claim holds at scale.
For policymakers and national innovation bodies, the 0.7% quantification rate across 5,346 records provides the most precise available baseline against which the effect of mandatory sustainability disclosure regulation can be measured as it takes force across multiple jurisdictions. The report recommends tracking the quantified share of carbon statements as a monthly series — currently 21.7% of the 166 carbon-stating records — as the earliest leading indicator of disclosure regulation surfacing in corporate communications, ahead of any annual reporting cycle. The near-total absence of Scope 3 disclosure despite its regulatory expansion identifies the specific field that national sustainability reporting frameworks should monitor most closely: an increase in Scope 3 records from four per month toward a visible share of the stream would confirm that supply-chain accounting requirements are beginning to operate as intended rather than remaining confined to formal annual disclosures.
InnoDexis Statement
"Two thousand seven hundred companies said sustainability mattered to them in July 2026 — thirty-six said by how much, and those thirty-six averaged nearly two full points above the stream mean, confirming that the measurement is what tracks quality, not the claim," noted InnoDexis in its latest intelligence report.
Conclusion
The Claim and Measure report establishes that unquantified ESG claims are a negatively predictive signal in the InnoDexis Corporate stream, that quantified environmental disclosure is one of the highest-yield filters identified across the July series at a 7.42 mean score on 36 records, and that corporate sustainability communication is overwhelmingly social rather than environmental — with SDG3 Good Health accounting for more than half of all SDG mappings and Scope 3 emissions present in only four records of which one is quantified. Across 2,697 ESG-claiming and 36 quantified-environmental records from 5,346 valid Corporate-stream entries, the evidence confirms a disclosure ladder that climbs nearly two points from unquantified claim to measured figure, a physical-footprint dividing line that explains the social-environmental sector split, and a Scope 3 gap that is the most structurally significant measurement absence in the current data. As the quantified share of carbon statements is tracked monthly as a disclosure-regulation indicator, a Scope 3 field is added to the schema, and the quantified environmental cohort is monitored for readiness level progression, the Claim and Measure framework will provide the most structurally honest sustainability intelligence the InnoDexis platform has yet produced. The complete Claim and Measure ESG and Sustainability Intelligence July 2026 Report is available to InnoDexis subscribers and enterprise clients.
About InnoDexis
InnoDexis is a global Innovation Intelligence platform that tracks, analyzes, and interprets breakthrough innovations, prototypes, and emerging technologies across industries and countries. Its intelligence helps corporates, investors, and policymakers understand the true structure and direction of global innovation. Learn more at innodexis.ai.