Only 2.1% of High-Potential Research Reaches Commercial Launch as Portugal, Singapore, and France Lead Global Innovation Migration Rates
A six-stage migration model applied to 17,991 Institute-stream records reveals that the steepest drop in the lab-to-market pipeline occurs between corporate engagement and startup formation, with Agriculture and Food and Healthcare and Biopharma advancing at rates well below the stream average.
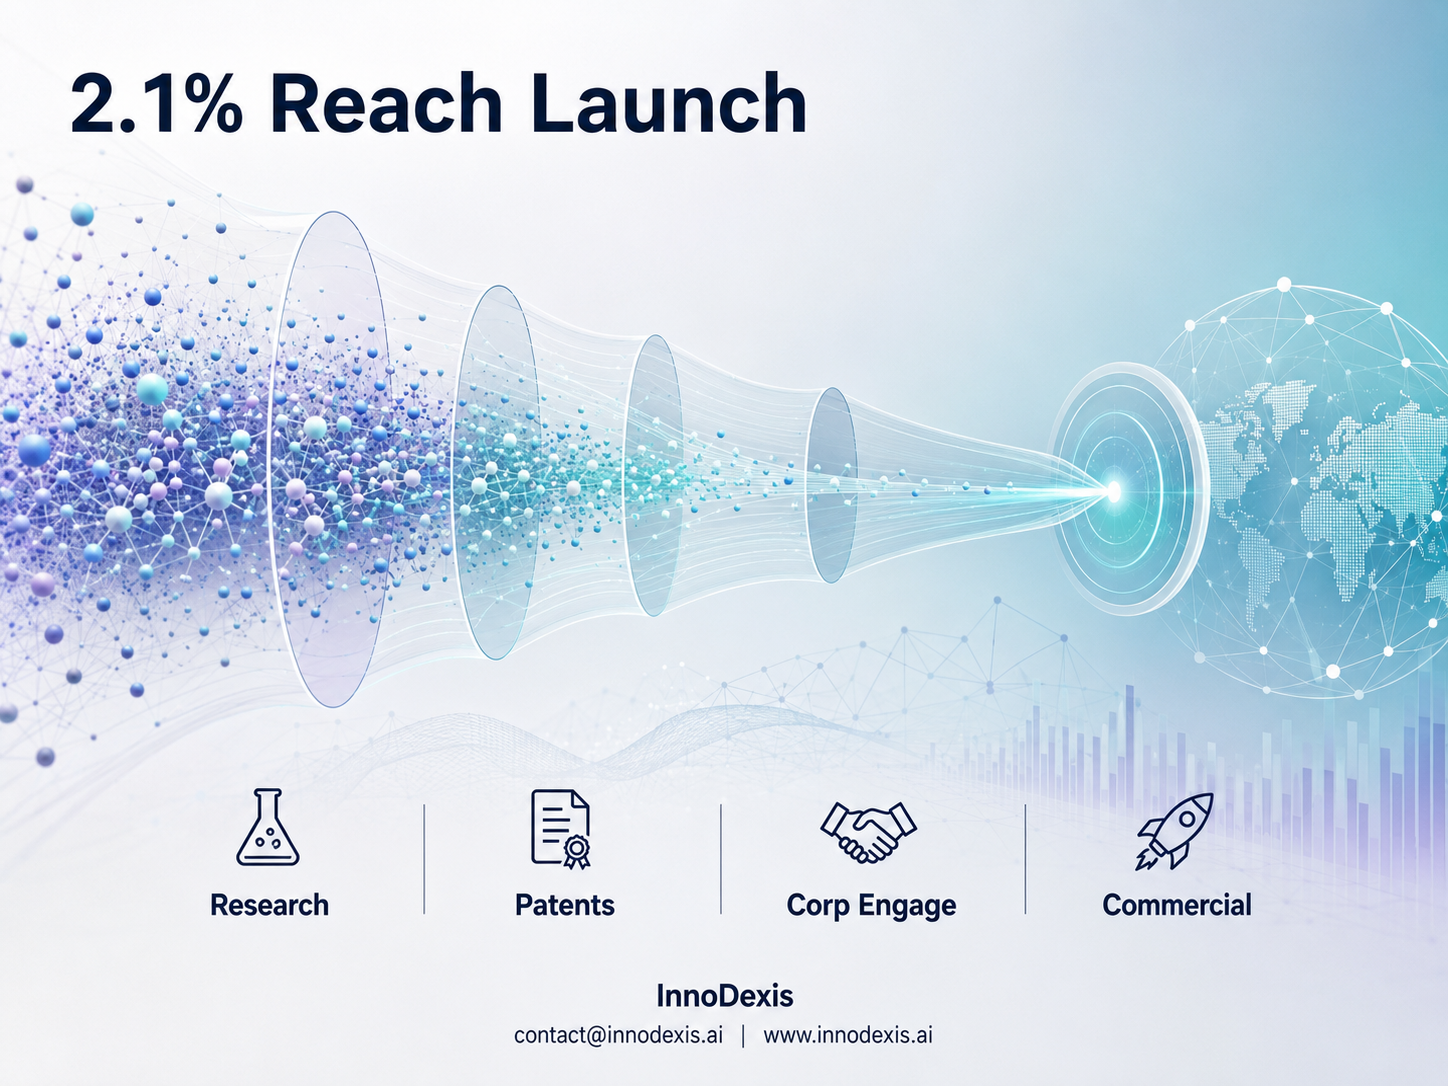
[HEADLINE]
Only 2.1% of High-Potential Research Reaches Commercial Launch as Portugal, Singapore, and France Lead Global Innovation Migration Rates
[SUB-HEADLINE]
A six-stage migration model applied to 17,991 Institute-stream records reveals that the steepest drop in the lab-to-market pipeline occurs between corporate engagement and startup formation, with Agriculture and Food and Healthcare and Biopharma advancing at rates well below the stream average.
InnoDexis has published its latest Innovation Intelligence Report covering the global path from scientific discovery to commercial deployment, analyzing 17,991 Institute-stream records at TRL 1–4 during the May 2026 dataset window, cross-referenced against the Corporate stream. The report reveals that while 25.7% of high-potential research reaches confirmed corporate engagement, only 2.1% is confirmed to reach commercial launch within the window this dataset covers. Five individually verified lab-to-market journeys — spanning the United Kingdom, United States, Canada, and Sweden — demonstrate that the migration path is real, trackable, and measurable at the record level.
Key Findings
The steepest single drop in the innovation migration funnel occurs between Corporate Engagement and Startup or Product Formation. Of 17,991 records analyzed, 25.7% reach confirmed corporate engagement — Stage 3 of the six-stage migration ladder — while only 6.4% advance to confirmed startup or product formation at Stage 4, representing a 75% relative decline between the two stages. This gap identifies the transition from named industry partner to actual company or product as the primary structural bottleneck in the global research-to-market pipeline.
One in three records reaches a built-and-tested prototype, and just over one in four shows patent activity. Specifically, 33.3% of records — or 5,986 of 17,991 — reach Stage 1 through prototype development, while 27.2% — or 4,889 records — reach Stage 2 through patent filing. The proximity of these two figures suggests that IP filing has become a routine early step for well-resourced research groups, while corporate engagement and company formation remain substantially harder transitions.
Portugal, Singapore, and France lead global advancement rates among countries with at least 100 tracked records. Portugal advances at 47.2% against a stream-wide average of 25.7%, followed by Singapore at 40.1% and France at 38.8%. The United Kingdom posts 33.1% and Germany 31.9% among the largest research-volume countries. Japan at 8.8% and China at 10.9% both land well below the stream average, a pattern the report attributes in part to sourcing-composition characteristics rather than a direct measure of underlying national commercialization capacity.
Agriculture and Food is the slowest-advancing industry bucket, with an advancement rate of 16.8% across 441 records — approximately 60% of the stream-wide average. Transportation and Logistics leads at 40.1% across 172 records, followed by Space and Defense at 35.2% across 548 records, both reflecting a sourcing pattern where named government or industry partners are often present from the earliest project announcement. Healthcare and Biopharma, the single largest bucket at 8,633 records representing 48% of the entire Institute stream, advances at 23.2% — below the stream average, consistent with the extended regulatory requirements governing clinical translation.
The University of Toronto contributed two of the five confirmed lab-to-market case files, with an institutional advancement rate of 42.0% across 69 tracked records. Carnegie Mellon University posts 48.6% across 70 records, and the University of Melbourne 48.4% across 31 records. The report notes that the University of Westminster's leading rate of 63.5% across 52 records has been flagged for internal validation before any external use, given its unexpected position relative to its research profile.
Five confirmed migrations were individually verified by matching Institute-stream startup mentions against Corporate-stream company records. Capture lag between the two streams ranges from 7 days for Shield Space — originating from the University of Leicester's Space Park — to 132 days for Synakis, a hydrogel-based retinal therapy startup traced to University of Toronto researcher Molly Shoichet's laboratory. The confirmed cases span orbital defense, liquid biopsy diagnostics, retinal therapeutics, sovereign AI, and advanced manufacturing quality management.
Strategic Insight and Trend Analysis
The central structural finding of this report is that the innovation migration pipeline is not uniformly slow — it is selectively blocked. The proximity of prototype rates (33.3%) and patent rates (27.2%) suggests that early-stage research groups are increasingly disciplined about IP protection. The collapse between corporate engagement (25.7%) and startup formation (6.4%) identifies the external-partner-to-company transition as the point where the largest proportion of viable research stalls, not the earlier laboratory or IP stages.
This finding reframes where intervention is most valuable. Technology-transfer offices, corporate venture arms, and government innovation programs that focus resources at the prototype-to-patent stage are investing where the pipeline is already relatively efficient. The structural gap is one stage later — between the point where a named industry partner has engaged and the point where a company or product actually forms around the research.
The country and industry rankings reinforce this argument with geographic and sectoral precision. Portugal and Singapore outperform research-volume leaders on advancement rate not because they produce more research, but because a higher proportion of their tracked research reaches external corporate engagement. Agriculture and Food's persistent underperformance despite its public-policy importance and large research base marks it as the highest-leverage sector for targeted translation support — not because the science is weaker, but because the institutional pathways connecting agricultural research to named industry partners are comparatively underdeveloped relative to fields like transportation, logistics, and defense, where government contract structures build external engagement in from the start.
The self-reported median commercialization timeline of 4 years, drawn from 364 records that disclosed one explicitly, provides the dataset's most defensible directional answer to how long the journey takes — while the report is explicit that this figure describes a self-selected 2% of the stream rather than the full pipeline.
Global and Industry Implications
For corporates and R&D teams, the industry advancement-rate breakdown in this report provides a direct prioritization tool for technology-scouting investment. Transportation and Logistics, Space and Defense, and AI and Computing advance at rates well above the stream average, meaning scouting resources deployed in these sectors encounter a denser population of research already connected to a named industry counterparty. Agriculture and Food and Healthcare and Biopharma, by contrast, offer larger raw research volumes but require greater investment in early-stage relationship building to reach the same Stage 3 threshold.
For investors and capital allocators, the country advancement-rate leaderboard reorders the international opportunity set in a way that raw publication volume does not. Portugal, Singapore, and France each outperform the United States and China on the share of research reaching corporate engagement, identifying these ecosystems as higher-efficiency sourcing environments per record reviewed. The five confirmed migration case files — each with a named company, a named institution, and a measurable capture lag — demonstrate that the pipeline produces verifiable commercial outcomes, not only population-level statistics.
For policymakers and national innovation bodies, Agriculture and Food's 16.8% advancement rate against a stream average of 25.7% provides a concrete, evidence-based case for targeted commercialization-support investment in a sector of significant public-policy importance. The university leaderboard in this report offers a directly actionable benchmarking tool for technology-transfer funding decisions, pairing institutional advancement rates with sample sizes and sourcing-composition caveats to support evidence-based rather than reputation-based resource allocation.
InnoDexis Statement
"The lab-to-market pipeline does not fail uniformly — it stalls at a specific, identifiable point between corporate engagement and company formation, and the countries and institutions that clear that bottleneck most reliably are not always the ones producing the most research," noted InnoDexis in its latest intelligence report.
Conclusion
The Innovation Migration Report establishes that the journey from scientific discovery to commercial launch is structurally visible, measurable, and unevenly distributed across countries, industries, and institutions. Across 17,991 Institute-stream records, the evidence identifies a clear pipeline anatomy — from prototype through patent, corporate engagement, startup formation, and commercial launch — with the sharpest bottleneck concentrated between the third and fourth stages. As the Migration Ladder framework is applied to future data refreshes and extended to cover the Accelerator stream, the organizations with systematic visibility into where research stalls and where it flows will hold the most durable advantage in technology sourcing, partnership strategy, and research-to-market investment decisions. The complete Innovation Migration Report is available to InnoDexis subscribers and enterprise clients.
About InnoDexis
InnoDexis is a global Innovation Intelligence platform that tracks, analyzes, and interprets breakthrough innovations, prototypes, and emerging technologies across industries and countries. Its intelligence helps corporates, investors, and policymakers understand the true structure and direction of global innovation. Learn more at innodexis.ai.