A Third of 3,570 Product Launches Provide No Checkable Evidence as Evidence Density Predicts a 2.28-Point Score Spread and Agentic Capability Leads Every Quality Measure at 6.58
A field-level analysis of the largest record class in the Corporate stream finds that product launches score below the corpus average as a class, that filtering on three or more evidence fields retains the top 11% at a mean of 6.39 through an 89% volume reduction, and that phased release outscores immediate availability by more than a full point.
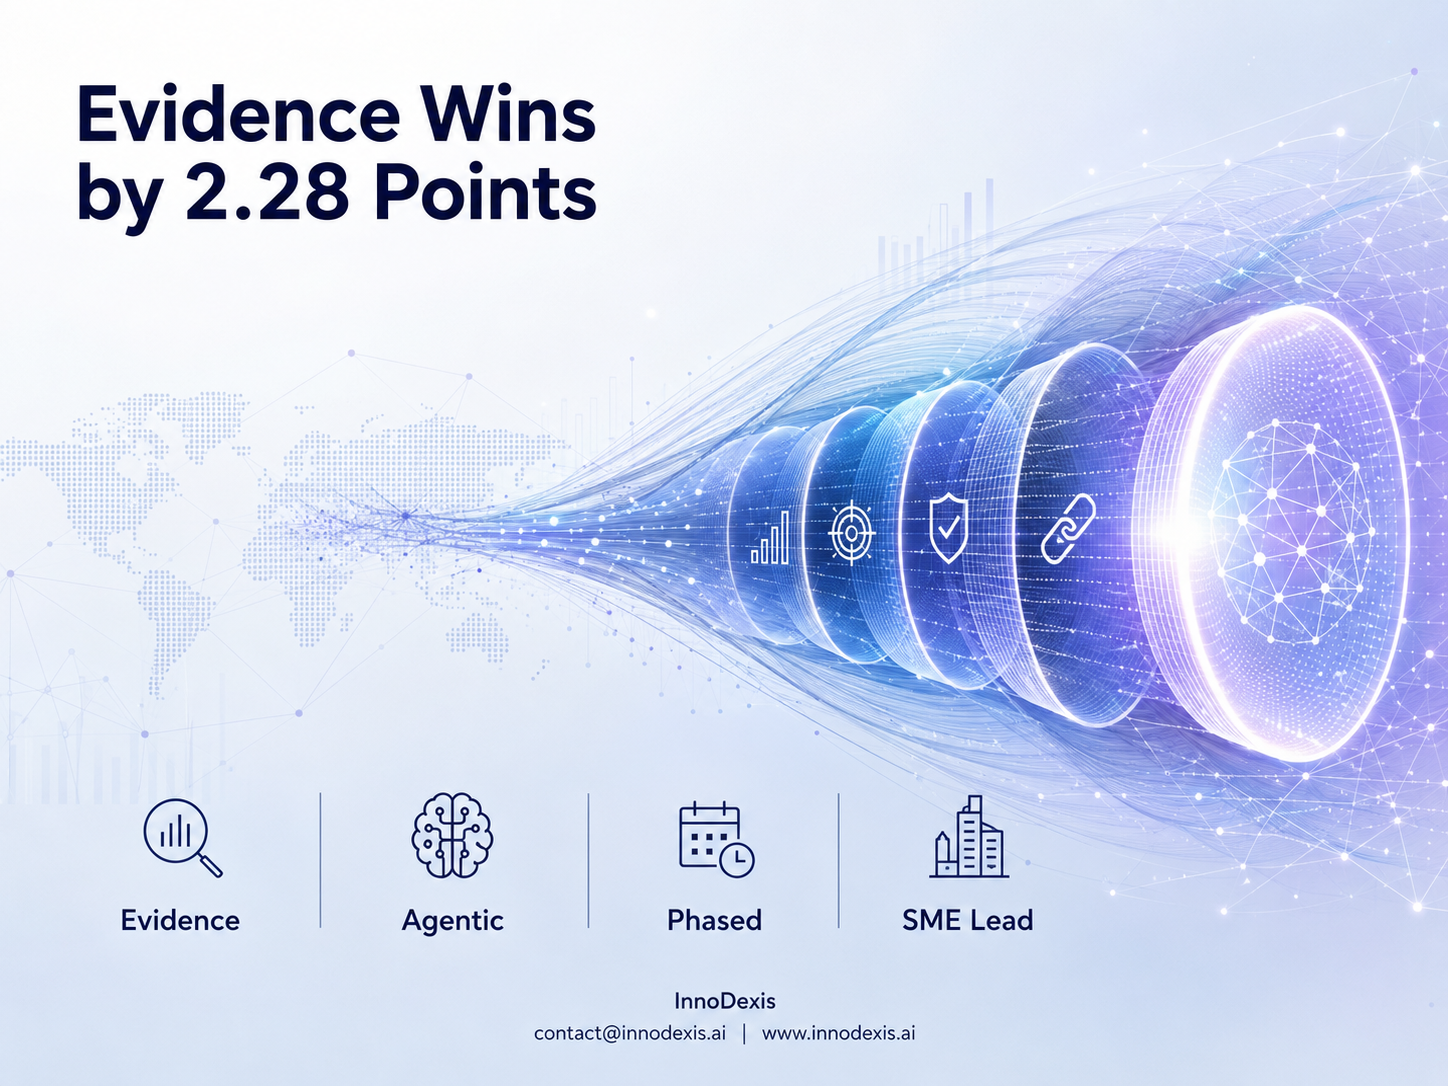
InnoDexis has published its latest Corporate Intelligence Report — Product Launch and Roadmap — analyzing 3,570 validated product launch and update records from 1 July to 21 August 2026, representing 37.1% of all corporate announcements in the window. The report reveals that the largest single record class in the corpus averages 5.24 on the InnoDexis score — marginally below the corpus baseline of 5.26 — with 11% rated High on investment attractiveness against 20% corpus-wide and 92% at TRL 8–9. A five-field evidence ladder spanning no evidence at 4.41 mean score to four fields at 6.69 produces the single strongest predictor identified in any report produced across the July to August 2026 cycle.
Key Findings
Evidence density, not novelty, determines whether a product launch signals. Five fields in the Corporate schema function as evidence markers — quantified results, performance KPIs, certification and accreditation, standards and protocols, and integration partners — with individual population rates ranging from 41.3% for quantified results to 12.8% for certification. Counting how many a launch populates produces a monotonic ladder: zero fields at 4.41 mean and 4% High investment attractiveness; one field at 5.25 and 9%; two at 5.88 and 19%; three at 6.30 and 25%; four at 6.69 and 48%. The InnoDexis score is not computed from these fields — the correlation confirms that companies with something real to describe describe it in checkable terms, and companies without something real do not.
One third of all product launches — 1,181 records — populate no evidence field at all. Two-thirds populate one or none. Only 94 records, representing 2.6% of the class, reach four fields. The mean evidence count across 3,570 records is 1.19. Quantified results is the most valuable single field: its absence costs 1.14 points of mean score, with launches carrying it averaging 5.91 against 4.77 for those without and High attractiveness running at 23% against 6%. Filtering on three or more evidence fields reduces 3,570 records to 408 — an 89% volume reduction — retaining records that average 6.39 with 26% High attractiveness.
Agentic and autonomous capability is the highest-scoring cluster across all twelve capability groupings, averaging 6.58 with 30% High attractiveness and 23% High disruption potential across 277 records — 7.8% of the class. This is a full half-point ahead of general AI and machine learning at 6.04, which appears in 32.2% of launches and has become close to a default claim with limited discriminating power on its own. The infrastructure layer within the agentic cluster carries the window's strongest records: Visa's Intelligent Commerce introducing agent scoring for autonomous-software-initiated payments, MoonPay's PayBox payment vault built explicitly for AI assistants, and GreenCore Solutions' CPG Knowledge Graph with production AI agents — the only record in the analysis populating all five evidence fields.
Launch timing inverts intuitive expectation. Products in phased release, beta, or early access score 6.13 across 136 records against 5.03 for immediately available products across 812 records — a 1.10-point differential. Staged rollout accompanies technically demanding products where the company expects to learn from limited deployment, meaning the engineering is not fully de-risked. An analyst filtering for products available immediately would systematically select the least innovative half of the class. The 136 phased-release records are 3.8% of launches and among the strongest. Launch availability is populated on 87.0% of records as free text while the structured start date field reaches only 12.9% — a 74-point gap identified as the clearest extraction opportunity in the cluster.
Personalisation and user experience at 847 records and 5.33 mean with 7% High attractiveness, integration and interoperability at 948 records and 5.58 with 10%, and analytics and insight at 503 records and 5.65 with 8% together account for 2,298 records — 64% of the class — and represent the low-signal bulk. These capabilities are expected rather than differentiating across most software categories, and a launch whose headline claim is one of them is describing parity with the market rather than advance. For coverage purposes these three clusters represent the deprioritisable block within the class.
Small and medium enterprises account for 35% of launch records and startups for 23% — 58% combined against a corpus-wide SME and startup share of 44.5%. Large corporates account for 14% of launches against 17.0% of the corpus. The launch class is the primary entry point for small-company visibility: a startup without a funding round, a contract award, or an acquisition has one reliable route into the corporate record, and it is to ship a product and say so. Quality filtering must operate on evidence density rather than entity size or the platform will systematically lose the small-company signal where early detection has most value.
Strategic Insight and Trend Analysis
The most consequential structural finding of the Product Launch and Roadmap report is the demonstration that the largest record class in the corpus is simultaneously the least innovative as a class and the most immediately improvable as a signal source. A 37.1% share of corporate volume at a mean score of 5.24 — marginally below the 5.26 baseline — describes a class dominated by finished-product announcements where the act of reaching market is the news rather than the nature of what has reached it. Yet the 2.28-point spread between zero and four evidence fields, computable today on every record in the database using five already-extracted fields, converts the same 3,570 records into a tiered signal instrument without any new extraction work.
The agentic cluster's current position — 7.8% of launches, 6.58 mean, 23% High disruption — represents the clearest forward signal available within the class, and its trajectory is predictable from the general AI cluster's history. General AI claims moved from differentiator to default between 2024 and 2026 and now appear in 32.2% of launches at 6.04 — still above average but no longer discriminating strongly. Agentic claims are earlier on the same curve. The threshold to monitor is whether agentic launch share passes 15%; at that point the current 6.58 mean will begin regressing as lower-substance products adopt the framing.
The August evidence decline from 1.50 fields per launch in mid-July to 0.84 in mid-August — a 44% fall accompanied by mean score falling from 5.78 to 4.70 — is the most operationally significant unresolved question the report raises. Two readings are available: genuine seasonal thinness, consistent with the corpus-wide August softening documented in the AI infrastructure analysis, or extraction degradation on the evidence fields. The practical guidance is the same under either reading — evidence density should be used at the record level rather than aggregated into weekly means until September data resolves the question.
Global and Industry Implications
For investors and corporate development teams, the diligence heuristic the evidence ladder provides is directly deployable. A launch with no quantified results, no KPIs, no certification, no standards conformance, and no named integration partners averages 4.41 and is rated High on attractiveness 4% of the time — that is one third of the market and it can be screened out at zero cost. Within the agentic cluster, the infrastructure layer — payment rails for autonomous software, trust-scoring frameworks, agent-facing APIs — is where the window's strongest records concentrate, and at 7.8% of launches it has not yet saturated the way general AI claims have at 32.2%. The evidence ladder also applies within the agentic cluster: Nokia's AI-RAN platform at four evidence fields and GreenCore's Knowledge Graph at five are structurally more defensible claims than agentic announcements populating zero fields.
For companies announcing products, the data describes a low bar that most of the market fails to clear. Two-thirds of product launches provide one or zero pieces of checkable evidence. A company providing three fields places itself in the top 11% of its class by evidence density and averages 6.30 — more than a full point above the class mean of 5.24. The single most valuable addition is a quantified result, present on 41.3% of launches and costing 1.14 points of mean score in its absence. The second most valuable addition is standards conformance at 5.99 mean, which is frequently already documented internally and simply not stated in the announcement. The implication is that the announcement, not the product, is where most companies are leaving signal on the table.
For policymakers and national innovation bodies, the 58% small-company share of launch records identifies product launches as the primary mechanism through which SMEs and startups communicate commercial progress to markets, partners, and procurement bodies that rely on open-source corporate intelligence. Any initiative designed to improve the visibility of small-company innovation — in national benchmarking, trade mission preparation, or procurement scouting — will find the launch class the highest-density source available, provided quality filtering operates on evidence density rather than entity size or announcement type alone. The 277 agentic launch records are concentrated in financial infrastructure, connectivity, and enterprise software — domains where SME and startup activity is generating the payment rails and trust mechanisms that will underpin the next generation of autonomous commercial systems.
InnoDexis Statement
"A third of the corporate world's product announcements provide nothing a reader could verify — and the scoring is correctly registering that at 4.41, which is nearly two full points below the launches that bother to supply four pieces of evidence," noted InnoDexis in its latest intelligence report.
Conclusion
The Product Launch and Roadmap report establishes that the largest record class in the Corporate stream is simultaneously the least innovative as a class and the most immediately improvable as a signal instrument — with a five-field evidence ladder computable today on every record producing a 2.28-point spread that predicts quality without any new extraction work. Across 3,570 launch and update records from 1 July to 21 August 2026, the evidence confirms that agentic capability at 7.8% of launches and 6.58 mean has not yet saturated the way general AI claims have, that phased release outscores immediate availability by more than a full point, and that 58% of launches originate from SMEs and startups making this class the primary route through which small companies become visible in the corpus. As the evidence count is computed as a stored field, launch availability is structured to close the 74-point gap between free-text and structured date coverage, the August evidence decline is resolved against September data, and agentic saturation is monitored against the general AI precedent, the Product Launch and Roadmap framework will provide the most operationally precise product intelligence the InnoDexis platform has yet produced. The complete Product Launch and Roadmap July to August 2026 Report is available to InnoDexis subscribers and enterprise clients.
About InnoDexis
InnoDexis is a global Innovation Intelligence platform that tracks, analyzes, and interprets breakthrough innovations, prototypes, and emerging technologies across industries and countries. Its intelligence helps corporates, investors, and policymakers understand the true structure and direction of global innovation. Learn more at innodexis.ai.